What inflation actually costs the American family.
The Consumer Price Index gets the cheap stuff right and the expensive stuff wrong. The Reality Index measures the gap between what the government reports and what families actually pay.
The Reality Index argues that official CPI inflation understates the real cost increases for American families by a lot — especially on big expenses like housing and healthcare, while overstating rises in cheap stuff like food.
Key Numbers (1980–2025)
- Reality Index basket: $100 of typical 1980 family goods/services now costs $516 (5.16×).
- Official CPI: Same basket would cost only $391 (~3.91×).
- Gap is driven by housing (6.1× vs. CPI) and especially healthcare (15.6× vs. CPI).
- American Dream Index: A fixed 1980 middle-class lifestyle (house, cars, kids, health insurance) now eats up 145% of median household income (vs. much less back then).
Core claim: Government CPI methodology (hedonic adjustments, substitution, etc.) hides how much more expensive the “big stuff” that defines middle-class life has gotten. The site provides charts, methodology, and item-by-item comparisons to back it up. It’s an independent project pushing a “reality check” on inflation stats.
In short: Inflation feels (and mostly is) worse than the headlines say.
***
The headline inflation rate
What inflation has really been for the past 55 years.
The Reality Index headline inflation rate: a weighted average of what families actually paid for the goods and services that make up household life, compared directly to the official Consumer Price Index using identical weights but real retail prices.
The headline finding. A basket of goods and services that cost $100 in 1980 costs $515 per the Reality Index in 2025, versus $391 per the official CPI. The Reality Index ran 32.0% faster than CPI over 45 years.
Two inflation crises. Extending the data back to 1970 captures the previous inflation crisis (peak: 1979, Reality Index +16.2% year-over-year; CPI +11.3%) alongside the current one (peak so far: 2022, Reality Index +13.0%; CPI +8.0%). The two episodes look comparable in scale by Reality Index measure; the 1970s look slightly worse by CPI measure. Over the full 55-year window, Reality Index ran 54.4% faster than CPI.
Apples to apples, not weights to weights. Reality Index uses the exact same household-spending weights that BLS uses for CPI (the Consumer Expenditure Survey, December 2024). The only difference between our index and theirs is the prices feeding the buckets. Where independent retail and consumer data exists — Kaiser Family Foundation for family health insurance premiums, NCES for college tuition, FHFA for home prices, AAA for vehicle costs, EIA for gasoline, BLS Average Price Data for retail food and electricity — we use it. Where it doesn’t exist (dining out, communications, recreation), we fall back to the BLS CPI subindexes. The methodological principle: independent data wherever it exists, BLS subindex chaining only where it doesn’t.
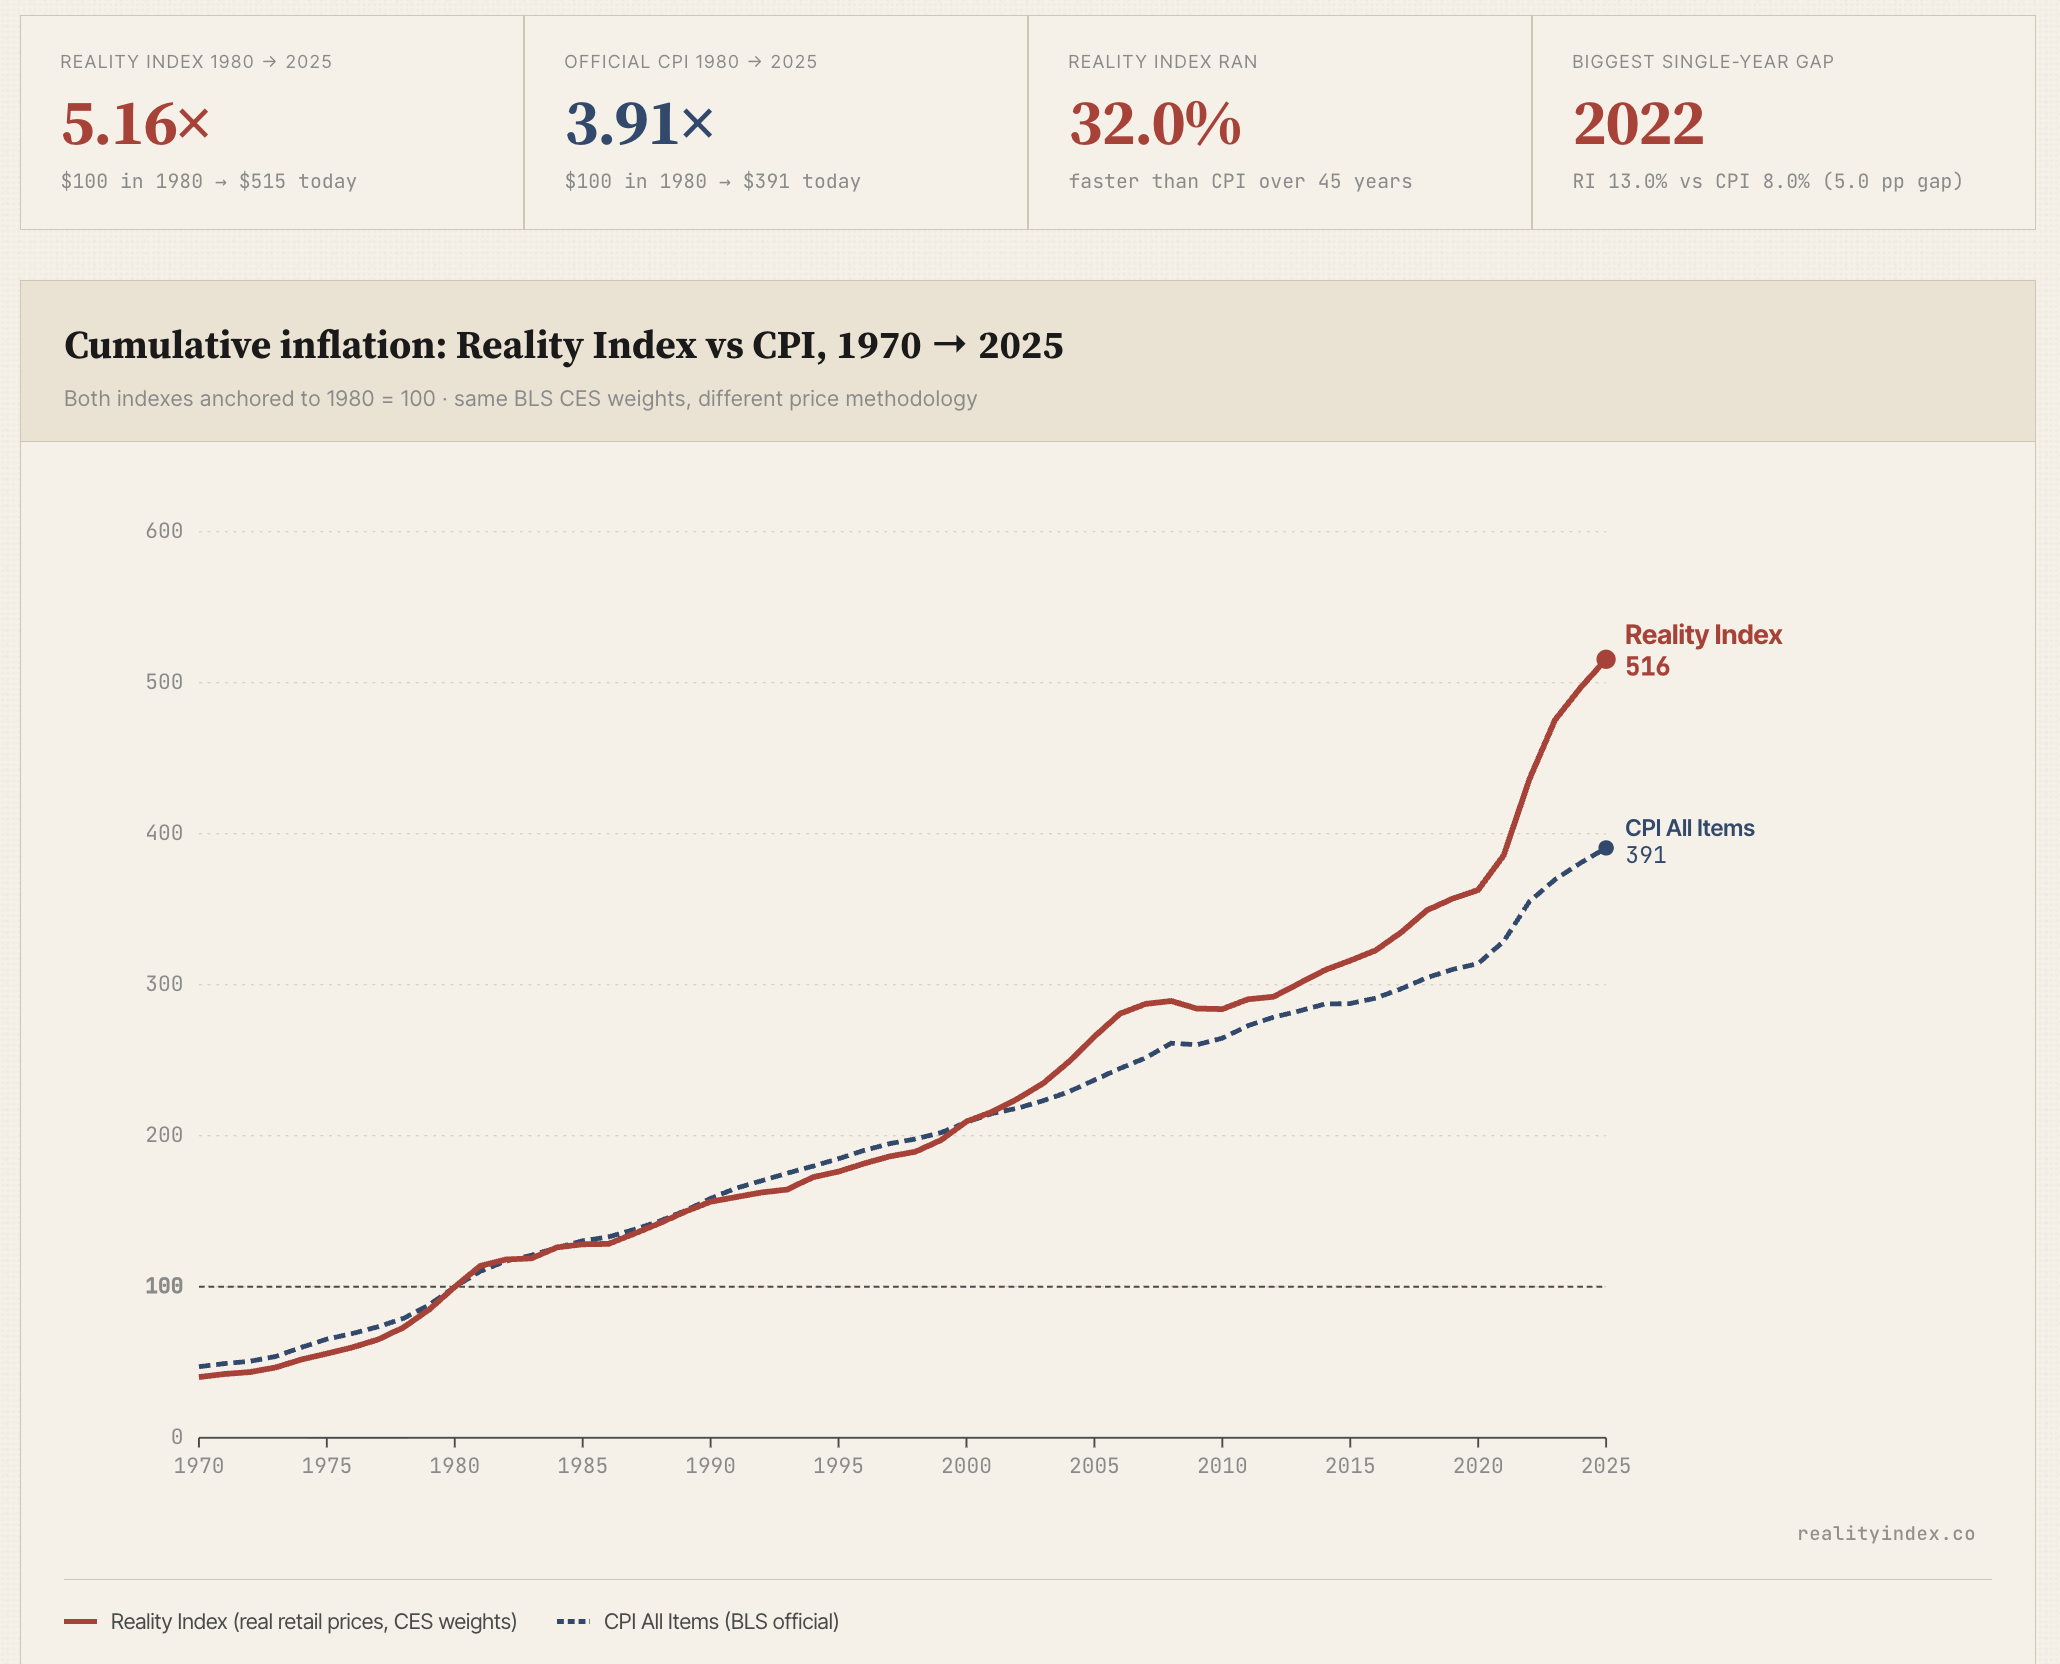
Reading the chart. The 1970s show the previous American inflation crisis. Reality Index and CPI tracked together through the late 1970s, with the Reality Index pulling slightly ahead during the 1978-1979 peak. Through the 1980s and 1990s, the two lines tracked closely, sometimes with Reality Index running below CPI. The systematic divergence begins around 2000 as housing services and health care costs grow faster than CPI captures. The post-2020 period shows the largest sustained gap in the series: a five-year stretch of Reality Index running 1-5 percentage points above CPI year-over-year. The 1980-2025 cumulative effect: 32% more inflation per Reality Index than per the official CPI. The 1970-2025 cumulative effect: 54.4% more.
Pre-1980 methodology disclosure. Independent retail dollar data for individual food items begins in 1980 with BLS’s Average Price Data series. For 1970-1979, the Reality Index is constructed from BLS subindex chaining — the same methodology BLS uses to construct CPI itself. The methodological differentiation between Reality Index and CPI begins meaningfully in 1980 when APU retail dollar data starts. We include the 1970s for historical context, but the 1970s portion of the line is methodologically less differentiated from CPI than the 1980+ portion. The KFF substitution for health care premium (vs. BLS medical) begins in 1999. The FHFA home price substitution begins in 1975; for 1970-1974, FHFA is chained backward via the BLS rent subindex.
***
American Dream Index
What the American Dream costs the median family, year by year.
A fixed specification of the 1980 middle-class lifestyle — a four-bedroom home, three children, two cars, one dog, employer health coverage, modest discretionary spending — priced annually from 1980 to 2025.
The headline finding. The American Dream cost 159% of median household income in 1980. It costs 145% in 2025. The squeeze is older than the political class will admit. The middle-class American life that 1980 promised has been priced beyond the median family’s reach for at least 45 years — and that gap has not closed.
What changed. The dollar cost grew 5.16x in nominal terms (1980 → 2025), while median household income grew 4.89x. The aggregate ratio improved slightly, but the composition shifted hard: health care grew 7.5x (about double CPI All Items), the housing carrying cost grew 4.2x, and groceries grew 3.3x. Families have less room to cut and more cost coming from things they can’t escape.
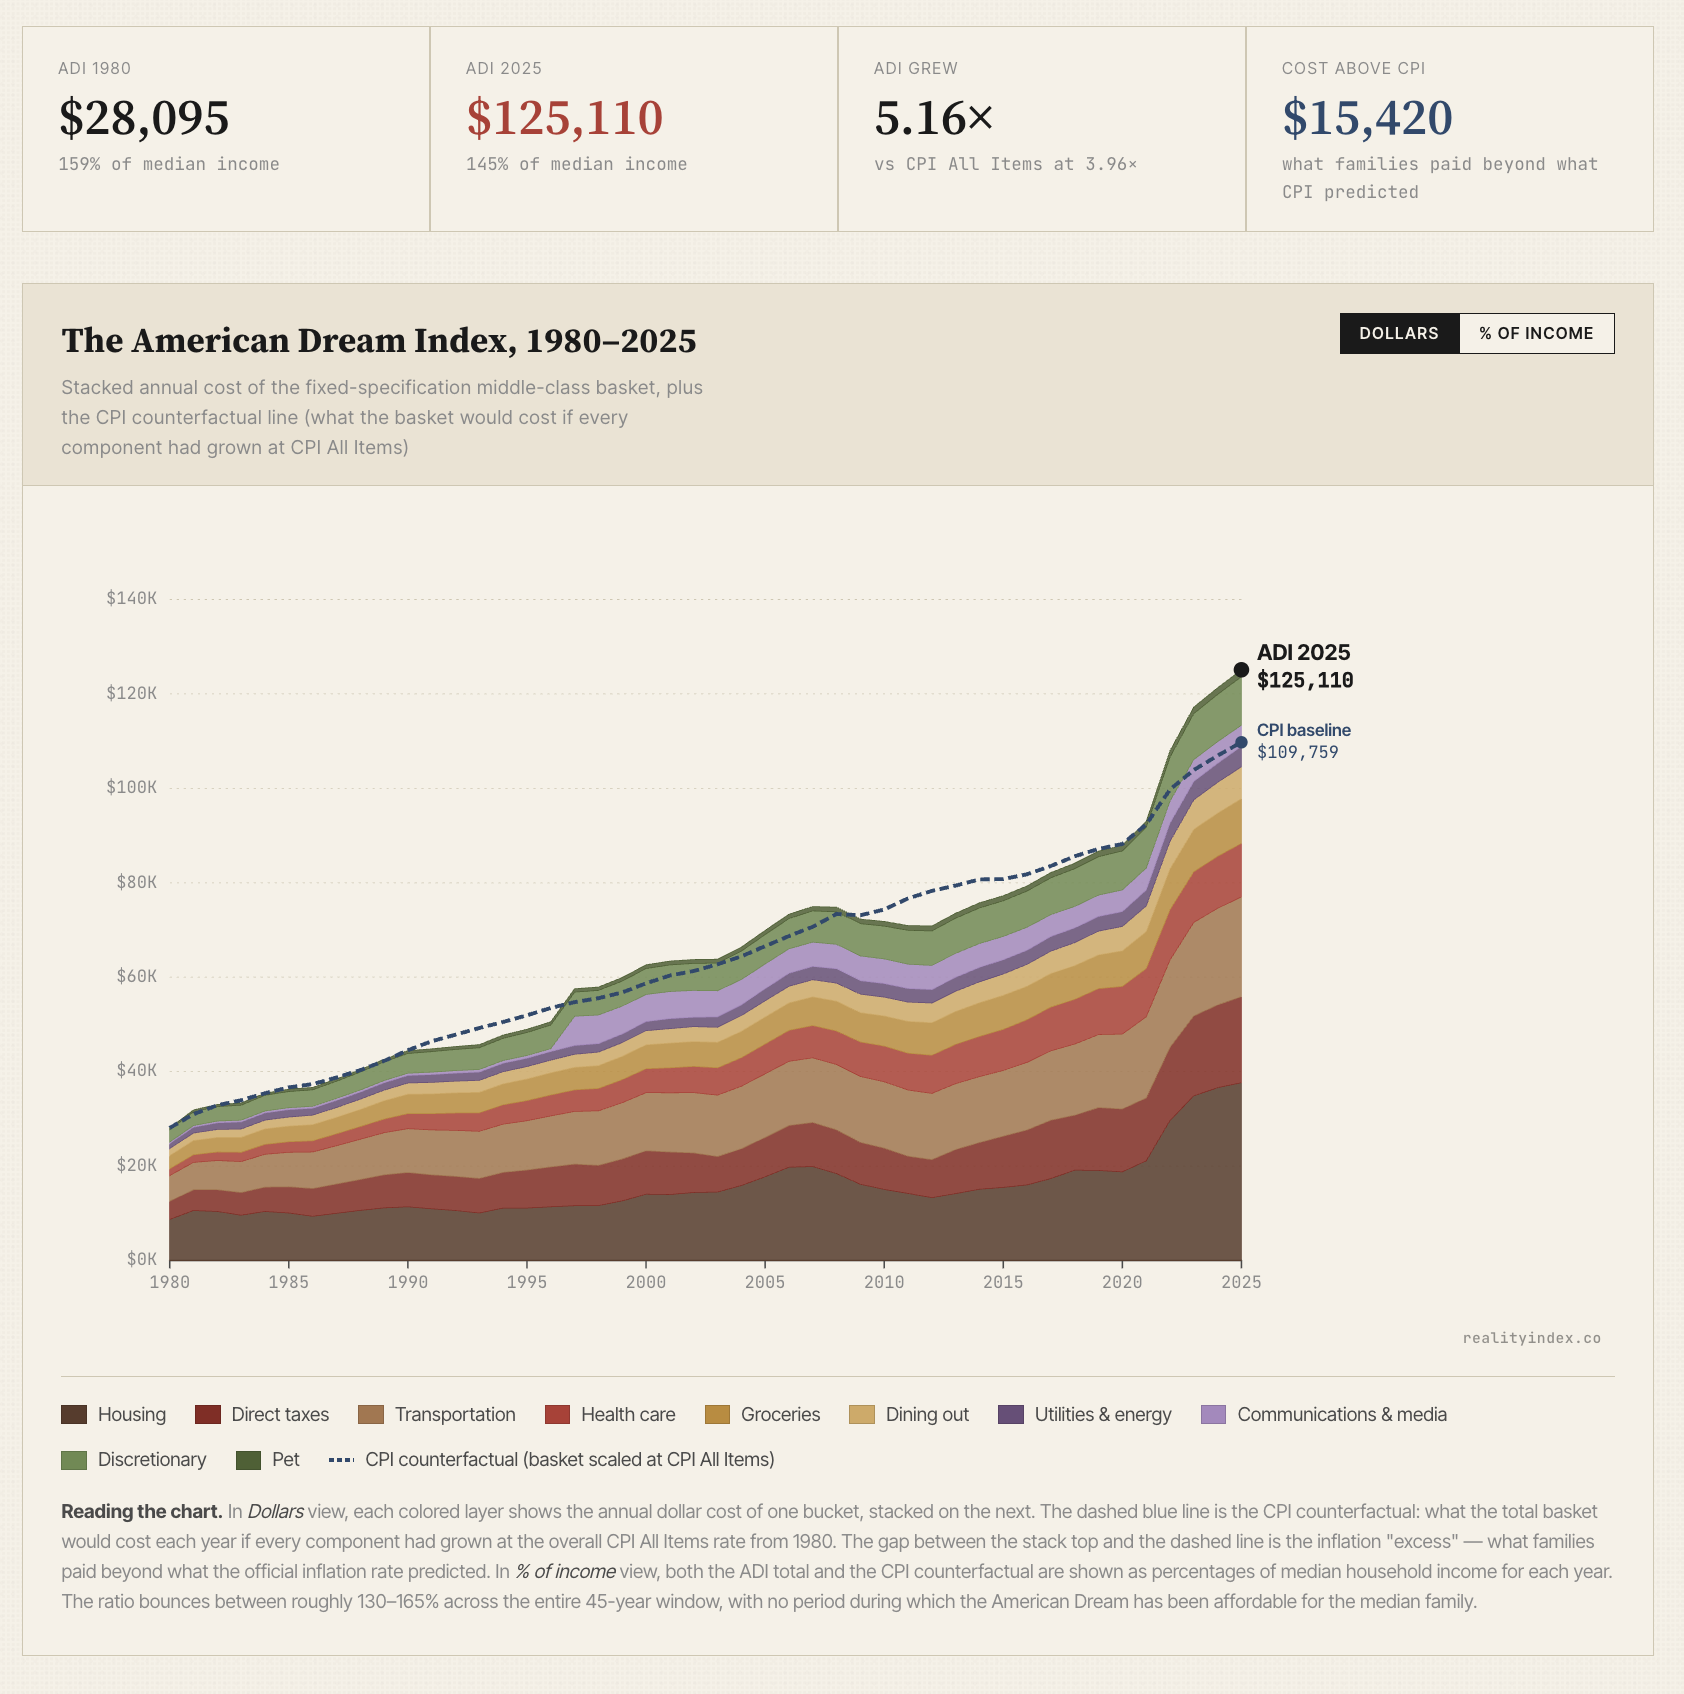
Reading the chart. In Dollars view, each colored layer shows the annual dollar cost of one bucket, stacked on the next. The dashed blue line is the CPI counterfactual: what the total basket would cost each year if every component had grown at the overall CPI All Items rate from 1980. The gap between the stack top and the dashed line is the inflation “excess” — what families paid beyond what the official inflation rate predicted. In % of income view, both the ADI total and the CPI counterfactual are shown as percentages of median household income for each year. The ratio bounces between roughly 130–165% across the entire 45-year window, with no period during which the American Dream has been affordable for the median family.
Discover more from The Property and Freedom Society
Subscribe to get the latest posts sent to your email.